


Oracles
To set the context, it is crucial to understand the difference between two categories of price sources: external data oracles and on-chain protocols.
External data oracles such as Chainlink, Pyth, Switchboard, typically consist of a network of providers delivering external data in the form of a feed, while complying with strict rules for the data to be considered valid. Each provider submits their observation (for instance, the ETH/USD price), and the oracle system combines these submissions using various methods to derive a final value.
In contrast, on-chain sources like AMM pool data, TWAP, or others directly originate from smart contracts exposing data for other protocols to use.
Oracle networks are often considered more secure than their on-chain counterparts as they are usually harder to manipulate, but this comes at a price: Trust.
The Architecture of Trust
Modern oracle systems employ various mechanisms to ensure data reliability. Rather than relying on a single source, decentralized oracle networks aggregate information from multiple independent data providers. This aggregation process is crucial. In traditional finance, a single trusted entity like an exchange might provide official prices. In DeFi, any individual data source could be compromised or simply incorrect. By combining multiple sources, financial incentives and statistical methods to filter out anomalies, oracles aim to provide robust, manipulation-resistant data feeds.
The Hidden Complexity
While oracles solve the problem of bringing external data on-chain, they introduce their own complexities and potential vulnerabilities. The way oracle data is processed, aggregated, and validated can create subtle attack vectors that aren't immediately obvious.
In a recent audit, we discovered that seemingly reasonable mathematical approaches to price aggregation can harbor significant vulnerabilities. One such issue involves the misapplication of statistical methods that, while appearing robust on the surface, can be exploited.
Switchboard Price Feeds
The Switchboard price feeds can be permissionlessly deployed and expose detailed live information and/or configuration options that developers can then use to define pricing mechanisms.
A price feed admin can define configuration parameters such as maximum allowed variance, staleness, and/or the minimum number of responses required for a submission to be valid. These parameters directly influence the reliability of the reported price and are accessible on-chain via the PullFeedAccountData struct.
Each parameter gives developers granular control over accuracy requirements and serve a distinct role:
- The max_variance field ensures that only submissions with acceptable statistical consistency are accepted, filtering out potential outliers or manipulation attempts.
- min_responses and min_sample_size enforce that a sufficient number of independent oracle submissions contribute to each price update, preventing scenarios where a small number of potentially compromised oracles could skew the result.
- The max_staleness parameter ensures price freshness, which is crucial for fast-moving markets where stale data could lead to significant losses.
To access the price, developers can either read the submissions field which returns the 32 latest price submissions, or read the result field which returns statistical information on the current result: mean, variance, standard deviation, range, number of samples, and more.
Mean, Median and Standard Deviation
Before diving deeper into the vulnerability, let's clarify fundamental statistical concepts that are central to this issue:
Mean (Average)
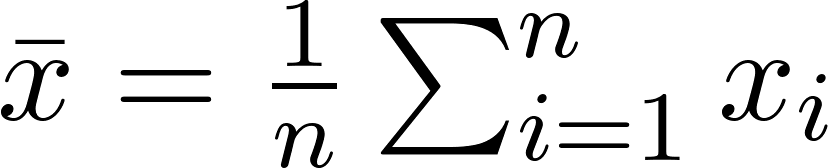
The mean is the sum of all values divided by the number of values, also called average.
Example:
Prices [100, 102, 104, 106, 108]
Mean = (100 + 102 + 104 + 106 + 108) / 5 = 104
The mean considers every value equally, making it sensitive to extreme values. A single outlier can significantly shift the mean, but the more samples are available, the lesser the effect of the outlier.
Median (Middle Value)
The median is the middle value when all numbers are arranged in order. For an odd number of values, it's the center value. For an even number, it's the average of the two center values.
Example:
Prices [100, 102, 104, 106, 108]
Median = 104 (the middle value)

Example with outlier: [100, 102, 104, 106, 500]
Median = 104 (still the middle value, unaffected by the outlier)
The median ignores extreme values, focusing only on the center of the distribution. This makes it more "robust" against manipulation.
Standard Deviation (Spread)
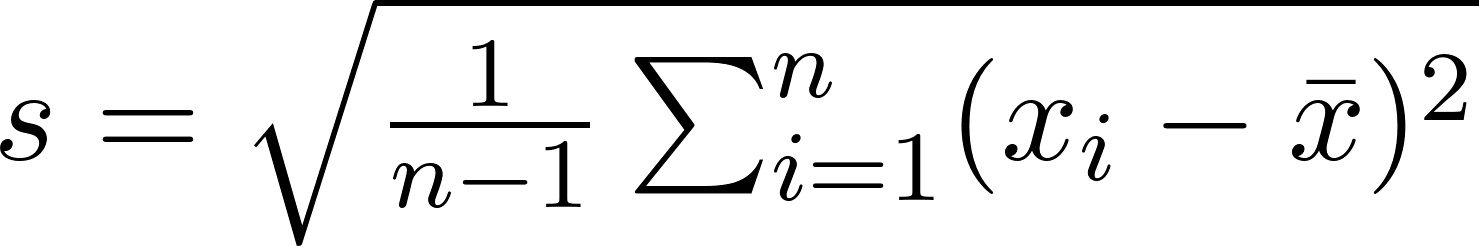
The standard deviation measures how spread out values are from the mean. A small standard deviation means values cluster close to the mean; a large one indicates wide dispersion.
Example:
Prices [100, 102, 104, 106, 108]
Mean = 104
Deviations from mean: [-4, -2, 0, 2, 4]
Standard deviation ≈ 2.83

Example with outlier: [100, 102, 104, 106, 200]
Mean = 122.4
Standard deviation ≈ 38.85
Crucially, standard deviation is calculated relative to the mean, not the median. It measures the average distance of all values from the mean, making it highly sensitive to outliers. Especially when giving attention to the formula: we observe that each term of the sum is squared: thus, the higher is the distance of an outlier to the mean, the more exaggerated it is.
Mistake #1: Mixing up Median and Standard Deviation
We observed an incorrect application of standard deviation to the median. This approach is mathematically inconsistent for the following reasons:
Standard deviation measures the spread around the mean, not the median: the resulting confidence intervals lack a sound mathematical basis and may provide a misleading sense of security regarding price bound. These statistics belong to different mathematical frameworks: The median is a robust statistic resistant to outliers, whereas standard deviation is not. This comes from the fact that the error term in the standard deviation formula is highly sensitive to outliers as the difference between the mean and the sample points is squared :
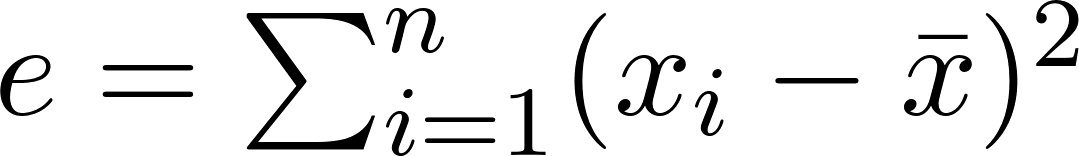
The more distant the sample point is to the mean, the more weight it has in the final result.
Let's examine a realistic oracle scenario with five ETH price submissions (in USD).
Scenario 1: Normal Oracle Submissions
Submissions: [2000, 2005, 2015, 2020, 2025]
Mean = (2000 + 2005 + 2015 + 2020 + 2025) / 5 = 2,013
Median = 2015 (middle value)
Standard Deviation = 9.27
In this scenario, the median and mean are very close, both accurately representing the true price. While applying standard deviation to the median is mathematically incorrect, the error introduced might be negligible if both values are sufficiently close.
Scenario 2: One Outlier
Submissions: [2000, 2005, 2015, 2020, 2200] (Attacker submits an extreme value: 2025 is replaced by 2200)

Mean = (2000 + 2005 + 2015 + 2020 + 2200) / 5 = 2048 (Shifted by approximately 2%)
Median = 2015 (Still the middle value, demonstrating robustness)
Standard Deviation = 84.3 (Massively inflated)
While the median successfully identifies the true market price of 2015 despite the manipulation attempt, the standard deviation calculation is corrupted by the same outlier that the median disregarded. This creates a fundamental inconsistency: the price estimate is accurate, but the uncertainty bounds are rendered meaningless.
This scenario was the one having the most impact throughout our review, as the implementation was using the standard deviation as a kill switch: if the value was greater than the maximum allowed, the oracle would revert. This allowed an attacker controlling a publisher to report a price sufficiently high to DoS the oracle, which as a result would have DoS the market, preventing liquidations or withdrawal until the problem is resolved. While the idea to use the median against such an event was effective, the use of the standard deviation cancelled the desired result.
Scenario 3: Additional Submission
Let's consider a specific scenario where the median could be more susceptible to manipulation:
Submissions: [1995, 2000, 2005, 2015, 2020, 2025] (Attacker submits an additional value)
Mean = (1995 + 2000 + 2005 + 2015 + 2020 + 2025) / 6 = 2010 (Shifted by approximately 0.1%)
Median = 2007.5 (Shifted by approximately 0.5%)
Standard Deviation = 10.80
This scenario reveals that the median is not universally more robust than the mean. When an attacker can add new submissions rather than replace existing ones, the median's vulnerability depends on the sample size and distribution. With small, even-numbered samples, strategic placement of outliers can shift the median more significantly than the mean in rare cases.
Mistake #2: Invalid Distributional Assumptions
We also observed an incorrect application of confidence intervals leading to incorrect assumptions on prices. This interval was then used to compute price boundaries [p - c; p + c] where p is the median price, and c the confidence interval.
A confidence interval is a range of values that provides an estimate of where a population parameter (like a mean or proportion) is likely to fall:
- It's expressed as an interval (e.g., 95% confidence interval: 45 to 55)
- The confidence level (commonly 90%, 95%, or 99%) tells us how often such intervals would contain the true parameter if we repeated the sampling process many times
- A 95% confidence interval means that if we constructed 100 such intervals from different samples, about 95 of them would contain the true population parameter
Confidence intervals are widely used in scientific research to report results from experiments and studies. Instead of only reporting a point estimate, researchers provide confidence intervals to show the precision and uncertainty of their measurements.
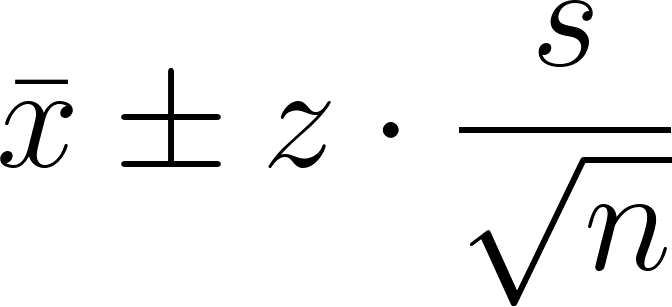
Z is the critical Z-value for a desired confidence level (e.g., 1.96 for 95%), s is the standard deviation, and n is the sample size. This is about estimating the population mean using a sample, and expressing how uncertain that estimate is. Let’s say you take a sample of 100 students marks, and you compute:
- Sample mean: x̄ = 72
- Sample std dev: s = 8
Then a 95% confidence interval is: Then a 95% confidence interval is:
x̄ ± z · (s / √n) = 72 ± 1.96 · (8 / √100) = 72 ± 1.568
So the interval is [70.43, 73.57]
Going back to our oracle, this implicitly assumes that:
- Oracle price submissions follow a normal distribution.
- Sample sizes are sufficient for the Central Limit Theorem to apply.
- Submissions are independent and identically distributed.
The typical threshold for normal distribution assumptions to be valid is n ≥ 30. For feeds with a number of samples below this value, the use of confidence intervals loses statistical meaning., which is the case for most Switchboard feeds.
We found that using this statistical tool would have allowed an attacker to easily manipulate the price boundaries. Depending on the operation, either the lower bound or the upper bound of the estimation was used as the operation price: the goal was to make sure that the protocol is always favored.
However, as demonstrated in scenario 2, the quadratic nature of the standard deviation calculation makes it particularly sensitive to outliers with small sample sizes. Each deviation term is squared in the formula, so extreme values have exponentially greater impact (a 2x outlier becomes 4x influence, 3x becomes 9x, etc.).
This mathematical property means that a single malicious publisher can significantly inflate the standard deviation, thereby widening the confidence intervals and potentially manipulating the price boundaries used by the protocol. In extreme cases, this could enable scenarios like forced liquidations.
The following code snippet illustrates all the issues together:
fn get_oracle_price(
    result: &OracleResult,
    max_uncertainty_bps: u32,
) -> Result<(i128, i128), &'static str> {
    let median = result.median_price;
    // Issue #1: No sample size validation - assumes normal distribution regardless
    // Issue #2: Mixing median with standard deviation (mathematically incorrect)
    let confidence_interval = result.std_dev * 196 / 100; // 1.96 multiplier

    // Issue #3: Check uncertainty derived from std dev against a limit, allowing for easy DoS
    let uncertainty_pct = (confidence_interval * 10000) / median;
    if uncertainty_pct >= max_uncertainty_bps as i128 {
        return Err("Price uncertainty exceeds maximum allowed");
    }

    // Issue #4: Compute min/max bounds allowing for price manipulation (bounded by the uncertainty check)
    let min_price = median - confidence_interval;
    let max_price = median + confidence_interval;

    Ok((min_price, max_price))
}
Alternative Approaches
Given the constraints of oracle environments (non-normal distributions, small sample sizes, and the need for outlier resistance) we can explore more suitable statistical approaches for handling price uncertainty. These constraints call for robust statistical methods that maintain their validity regardless of distributional assumptions and remain stable even when individual data points are compromised or manipulated.
Min and Max Price
The Switchboard feeds return a submissions field, which contains all individual price submissions. Multiple alternative approach for defining price bounds can be used:
- Using the submissions at positions n-1 and n+1 from the median value. These values are hard to manipulate, as manipulating them too much would result in their position being swapped with the n-2 or n+2 submission, which we can assume to be still fairly close to the real price.
- Using the MAD (median absolute deviation) which is a measurement similar to the standard deviation, but for the median and resistant to outlier. It can then be tweaked to be used to build boundaries around the mean.
Uncertainty Threshold
The Median Absolute Deviation (MAD) is a measure of statistical dispersion that is resilient to outliers. That measurement can then be compared against a threshold, which should be determined based on the volatility of the analyzed asset:
- Stablecoins: Characterized by very stable prices.
- BTC, ETH, Altcoins: Generally less volatile than memecoins during periods of high market movement.
- Others (e.g., Memecoins): Exhibit very high volatility.
Outlier Detection and Filtering
Before calculating price bounds or uncertainty thresholds, submissions that are obvious outliers should be identified and excluded from the calculation. The MAD can be used as a robust outlier detection mechanism:
- Calculate initial MAD from all submissions
- Identify outliers as submissions where |submission - median| > k × MAD
- Remove outliers and recalculate median and MAD from the cleaned dataset
- Apply price bounds using the cleaned data
Conclusion
The vulnerabilities we've explored reveal an important challenge in modern DeFi: as protocols grow more sophisticated, new attack vectors can emerge from subtle statistical inconsistencies. The specific case of mixing median with standard deviation demonstrates how mathematically sound individual components can create security issues when combined.
As DeFi continues to mature, the intersection of statistics, cryptography, and economics will require interdisciplinary expertise. Understanding these nuanced interactions will be key to building the next generation of resilient financial infrastructure.
If your protocol uses oracles and relies on statistical filtering, confidence bounds, or aggregation logic, it’s worth giving that layer extra attention. These aren’t just edge cases, they’re common failure modes we see across mature protocols. The good news: with the right lens, they’re often easy to catch and fix before they become real problems.
Need a review of your oracle logic or aggregation layer? Request a quote to start an engagement with our team. We focus on the vulnerabilities that don’t show up in standard tests but matter in real-world adversarial conditions.